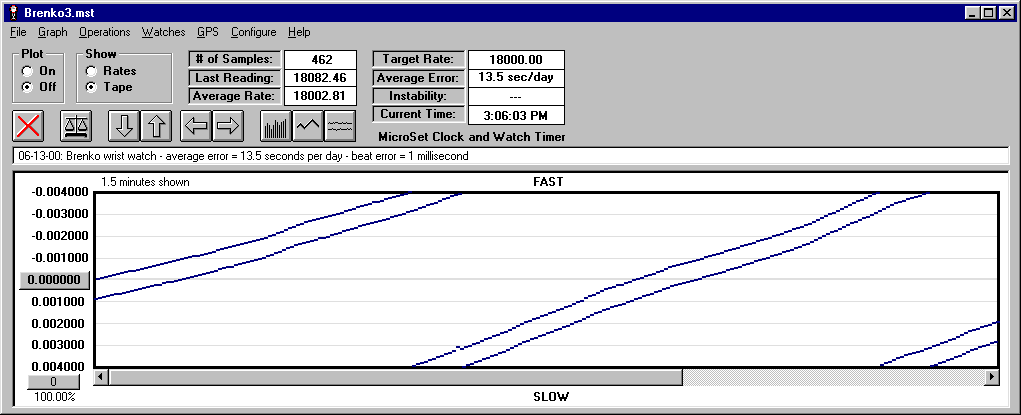
MicroSet 3 and version 3 of the Windows Interface Program can be used to simulate the paper tape strips that were used in early watch timing machines. If you're already familiar with one of these machines, you have learned how to read subtle changes in the patterns of dots to diagnose fauilts in a watch. MicroSet 3 allows you to use this skill with a modern, more accurate timer. A representative graph is shown below.
The graph shown here is rather wide, but on your own computer screen it can be as narrow as needed. You can scroll through its "length" with the scroll bar at the bottom of the screen. You can also compress it horizontally with the Left Arrow icon and expand or compress it vertically with the Up Arrow and Down Arrow icons. As with all other MicroSet graphs, you can save it on disk for a permanent record.
The graph is composed of two parallel rows of dots that drift off the top of the screen, then reappear at the bottom. This is to be consistent with the paper tape machines this graph represents. The slope of the line indicates the error of the watch, but we no longer need to measure the slope to determine the rate. The computer knows the rate much more accurately than we could measure it, and it's shown to be 13.5 seconds per day in this example.
We can also read the size of the beat error at the left edge of the graph. The edge is labeled in seconds to six decimal places. The separation between the two lines represents 1 millisecond of beat error.
MicroSet can do something that paper tape machines cannot. If you click on the Autoscale icon, MicroSet will "normalize" the graph so that the lines are horizontal. It does this by setting the Target Rate to the current Average Rate. This causes the lines to run down the center of the screen rather than drift off the top or bottom as they do when there's a rate error. By keeping the lines centered on the screen it's easier to evaluate how consistent the rate is and discern irregularities in the beat without being distracted by an overall rate error.
