MicroSet 3 can display a simulation of a conventional paper tape timer when used with the Windows Interface Program version 3. The following procedure can be used to set up the simulation.
Before starting the paper tape simulation, measure the watch with the line graph mode to see how well the watch is running and to adjust the Level control properly. The following steps may be used:
1) Set MicroSet 3 to "TIME: 1"
2) Set the Level control to maximum (clockwise)
3) Be sure the watch is fully wound and resting quietly in your sensor
4) Click on the RESET icon in the Windows program (the red "X") to delete any existing data
5) Click on the "PLOT: ON" button to start capturing data.
6) Watch the box that indicates "# of Samples". When you have at least five samples, click on the AUTOSCALE icon. This will arrange the data in the middle of the screen. I like to hit the DOWN ARROW a couple of times to get the data to fit more in the middle of the graph.
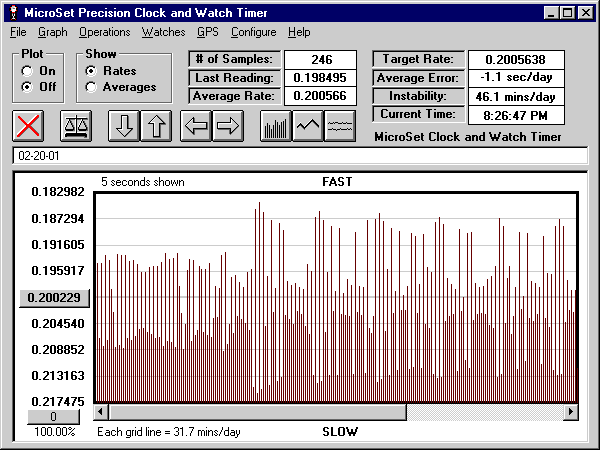
The graph you see will show you the beat error of the watch as measured by MicroSet. One line will be high, the next one low. These are the even and odd beats. You need to adjust the LEVEL CONTROL on MicroSet so that the pattern of up and down lines is regular. This indicates that MicroSet is triggering accurately on each beat. For example, the graph below shows bad data. The data lines are chaotic and irregular. This will not produce a paper tape display that is easy to read. The chaotic data may be caused by a faulty watch or by an improper setting of the LEVEL CONTROL.

Bad, chaotic data
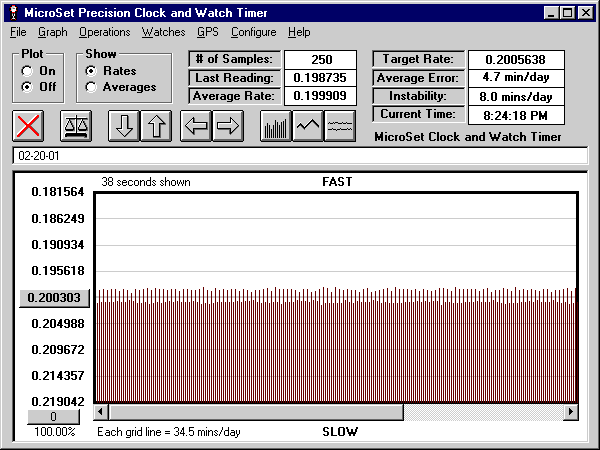
The next graph shows clean data that will produce a useful paper tape display. Adjust the LEVEL CONTROL of your MicroSet until you get a regular display like the one below. If there is no setting of MicroSet that produces a regular display, the watch may be running very poorly and be as inconsistent as the screen shows you. Or, if you're using the standard MicroSet clip-on acoustic sensor, you may wish to try one of the special watch sensors that pick up watches better. If you can't get a good graph, try a different watch. This will help you decide if the fault is in the watch or in the sensor you're using.
After a while the data lines will go out of sight on the right side of the screen. Click on the RESET icon to clear out the data and start fresh. Or click on the horizontal scroll bar below the graph to move to the right.

Good, clean data
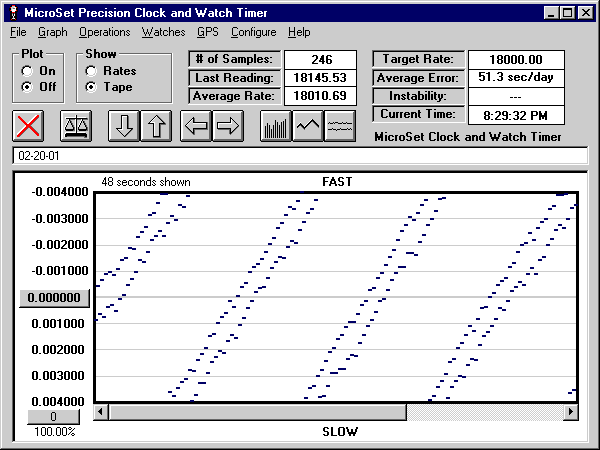
When you get a screen full of good data, click on the PLOT: OFF button to stop capturing new data. We can now turn the line graph into a paper tape display. Under the WATCHES menu, select PAPER TAPE SIMULTION. The program will ask you to enter the correct rate for this watch in Beats Per Hour. You should know what this value is. For example, a pocket watch is likely to be 18000 BPH. Enter the value that you think is correct and click on OK. The line graph will now change to a blue paper tape simulation. If the watch is not running close to the correct rate you selected, the lines will march off the screen at a diagonal. The graph below is an example of what you may see.

Paper tape simulation - watch is not at the correct rate
In a conventional paper tape timer, you would use a rotating disk to interpret the slope of the lines and read the rate. We don't have to do that, because we have a computer at our disposal. The computer has already calculated the error of our watch. In the sample graph above, you can see in the box labeled AVERAGE ERROR that it is 51.3 seconds per day fast. Because the computer will tell us exactly how fast or slow the watch is, we don't need to concern ourselves with the slope of the lines. This is where MicroSet begins to have a big advantage over convetional paper tape timers. We can tell MicroSet to make the diagonal lines flat because the slope no longer matters to us -- we can get the rate information from the AVERAGE ERROR box. By making the lines flat, we can more easily see inconsistency in the lines, which reveals subtlety in the action of the watch that is otherwise swamped and concealed by the slope.
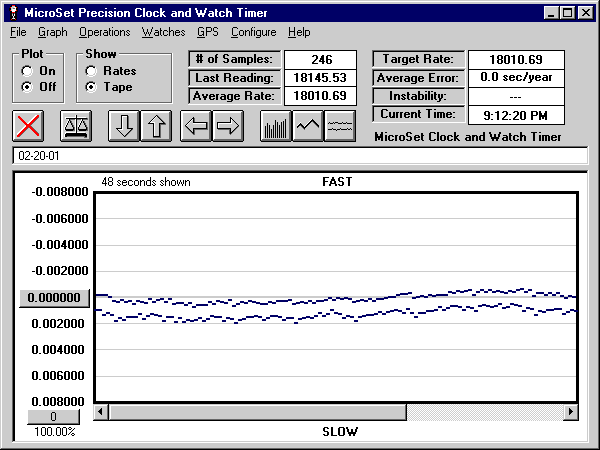
To make the lines flat, click on the AUTOSCALE icon. This changes the TARGET RATE from what you had previously entered as the correct rate to whatever the current AVERAGE RATE is. This makes the data lines flat, or nearly so. The graph below shows the results of this action.

Paper tape with TARGET RATE set to the current AVERAGE RATE
Notice how the slight wobble in the watch is now much more apparent. The AVERAGE ERROR now shows zero, because we set the TARGET RATE to the current rate. If you need to see the rate error again, simply reset the TARGET RATE to the correct rate for the watch.
We have done all of these operations on data that was already captured. Once you've configured the program to give you a reasonable display in this way, you can have MicroSet display the same data live, as the watch is ticking. To do this, after you get a good static display, click on the RESET icon to clear out the current data. Then click the PLOT: ON button to begin capturing new data. Any time the data lines move off the screen, you can click on the RESET icon again to erase the old data and start over.
If you wish to capture a long tape, just let the timer run. When you've collected what you want, you can save the file on disk. The program will save the raw watch data, and the next time you want to view the paper tape simulation, you must load the raw data and then enter the PAPER TAPE SIMULATION through the WATCHES menu.
When you have a paper tape simulation on the screen you can use the UP and DOWN ARROWs to magnify or reduce the vertical scale of the lines. However, you cannot use the LEFT ARROW to compress the horizontal dimension. This is because horizontal reduction conceals some beats, and you cannot get the paper tape simulation without seeing every beat.
Bryan Mumford
February 25, 2001