Starting in October of 2004,
MicroSet 3 is able to measure how wide a pendulum is swinging at the same time as it measures the rate of the pendulum. This feature requires Windows interface software version 2.4 or 3.4 to display the results. The method works with an optical or magnetic sensor. Every time MicroSet 3 completes a reading, it then measures the amount of time the sensor is triggered by the pendulum. If an optical sensor is used, this measurement is the time the sensor is blocked by the pendulum. If a magnetic sensor is used, the measurement is the amount of time the sensor is triggered by the magnet. The time the sensor is triggered represents the amplitude of swing. This will be explained in a moment.
The amplitude reading occurs at the completion of every rate reading. If MicroSet is configured to "Time: 10", it will measure ten beats, display the average rate during those ten beats, and generate an amplitude reading.
There are two ways to configure this function.
Measuring at the center of swing
The first method works with a sensor placed at the center of swing. The wider a pendulum is swinging, the faster it will pass through the center. When the pendulum is swinging less wide, it will pass through the center more slowly. MicroSet 3 will measure and display the speed at which the pendulum passes through the center. The latest versions of the Windows interface software will plot this new reading along with the usual rate reading.
The value of this amplitude reading is uncalibrated. That is, it does not correspond directly to any absolute measurement of the amplitude of swing. The values are relative, and show increases and decreases in amplitude to a fine scale.
Measuring at the side of swing
The optical or magnetic sensor can also be placed at one side of the swing and arranged so that the sensor is triggered continually until the pendulum reverses direction and returns. The wider the pendulum is swinging, the longer it will spend at the side. This produces a more sensitive reading of the amplitude, and it can be calibrated to display degrees of half swing or as linear travel from the center. The readings are converted to actual degrees of swing by the trigonometric calculations devised by Dr. David Smith at the Department of Mathematics of the University of Auckland in New Zealand. This calculation is known as the Smith Method and has been used with MicroSet for several years. The new versions of the MicroSet Windows interface software allow you to enter the necessary parameters to calculate the Smith Method from the amplitude readings. If calibrated values are not needed, the raw time values from the sensor at the side will show relative changes in amplitude to a finer scale than when the sensor is located at the center of swing. The rate reading generated in this mode is the time of one period rather than the time of one beat.
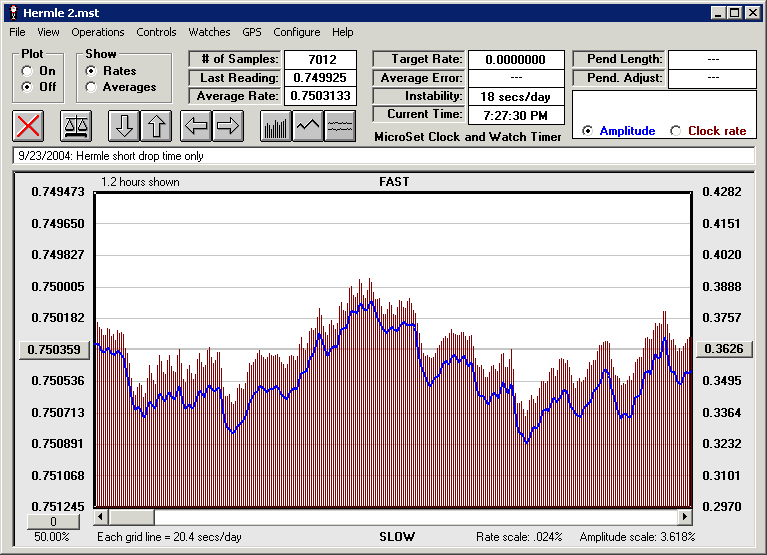
The graph below illustrates a typical amplitude reading. It measures a Hermle time only movement. The red vertical lines show the period of the pendulum. The blue line shows the amplitude of swing. The right axis labels the amplitude of half swing in inches from the center, calculated by the Smith Method. It is very common for the amplitude reading to follow the rate as is seen here. But this is not always the case.

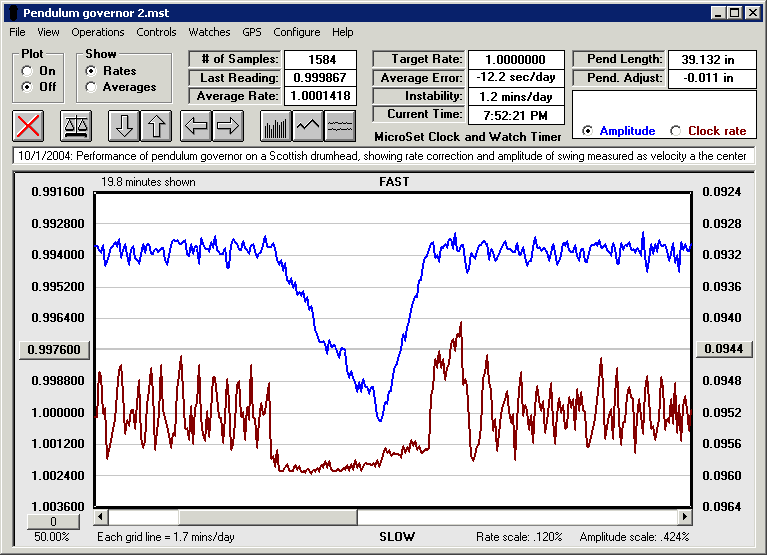
In the following graph the amplitude does not follow the rate at all. The red line is the rate, the blue line is the amplitude. This is an uncalibrated amplitude. The right axis is labeled with the raw timing values of an optical sensor placed at the center of swing.
This graph examines the performance of a circuit used to regulate a clock pendulum. The circuit monitors the pendulum and adjusts the rate when the clock is slow or fast. It does this by occasionally pushing on the pendulum, which keeps the amplitude artificially high. Near the middle of this graph the controlling circuit was disabled. The amplitude of the pendulum began to decay immediately. The rate of the pendulum fell to a certain value and stayed there. After a couple of minutes the circuit was energized again and the amplitude of swing returned to its high value and the regulated rate of the pendulum returned to an average value of 1.000000 seconds.

Bryan Mumford
Santa Barbara, California
October 01, 2004