|
Measuring Clocks and Watches
Other kinds of measurements
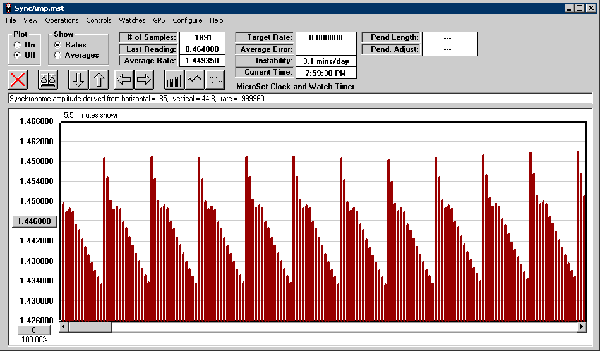
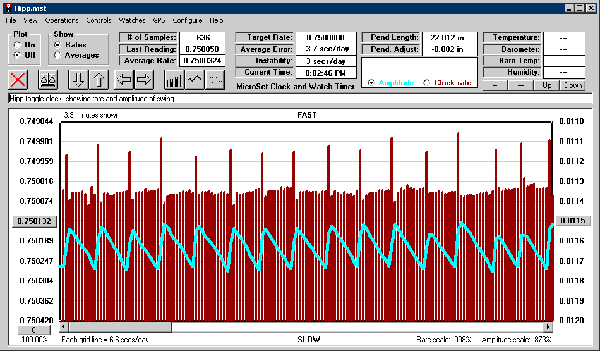
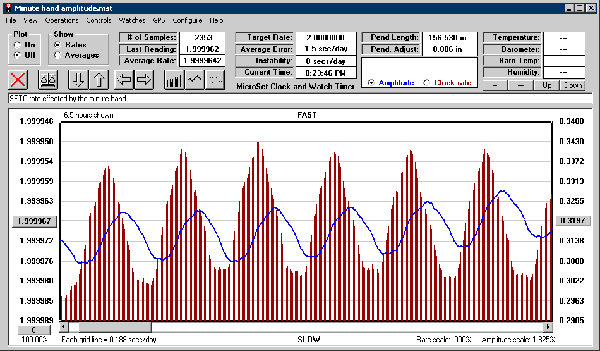
For the serious horologist, measuring the rate is just the beginning. There are many other parameters of clock operation that can be measured for a full picture of how the clock is performing. Measuring amplitude Dr. David J. Smith at the University of Auckland in New Zealand also noticed this effect and knew how to make use of it. Dr. Smith understood that the motion of the pendulum could be used with certain measurements of the setup to calculate the actual value of the amplitude of swing. The “Smith Method,” as it has come to be known, is a very useful offshoot of basic timing operations. The Smith calculations for computing amplitude are built into the Windows software that’s used with MicroSet, and they allow you to record the amplitude of a pendulum as it changes over time. This graph illustrates a dramatic example of changing amplitude. Each red line represents the amplitude of a Synchronome master clock over a two second interval. A Synchronome gets an impulse every 30 seconds, and between impulses, it coasts. This pattern is revealed in the sawtooth waveshape seen in the graph. As the clock coasts, the amplitude gets smaller. When the impulse is delivered, the amplitude is quickly restored to maximum. MicroSet is also able to combine simultaneous measurements of the rate and amplitude. In this graph of a Hipp toggle clock, you can see the two readings. The red vertical bars measure the rate of the clock, the blue sawtooth measures the amplitude. A Hipp toggle clock is driven by a magnetic impulse that’s delivered when the amplitude of swing has decayed below a threshold. In this graph you can see that the amplitude runs in a cycle like the Synchronome, decaying to a low value and then getting an impulse that restores the amplitude. You can compare this pattern with the rate reading in red. Every time the amplitude is restored, the rate gets a spike. Otherwise, the rate is stable while the amplitude decays. The following graph is another interesting example of rate and amplitude. This graph shows the behavior of a Standard Electric master clock. This clock has a minute hand that’s six inches long. It turns out the clock has some trouble making this big hand go around. The clock rate speeds up every hour as the hand falls from the 12 o’clock position to six, and it slows down when the hand has to pulled back up to 12. This is represented by the red lines of the graph. This effort also makes it’s way into the pendulum amplitude, which is represented by the blue line at the center of the graph. As the clock speeds up, the amplitude gradually increases. But the amplitude lags the rate a little. The heavy bob takes a little time to increase in amplitude. After the rate begins to slow down, the amplitude continues to rise for a few minutes, and then starts to decay.
|


