|
Measuring Clocks and Watches
The Timebase
Quartz timebase
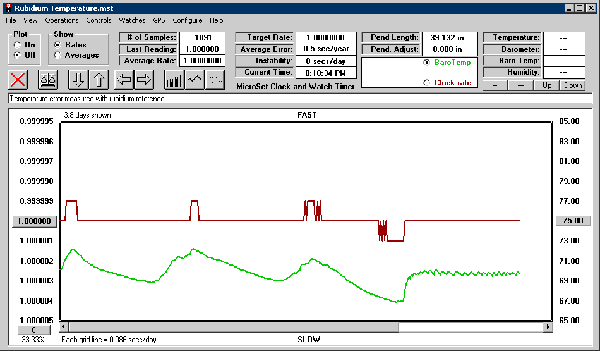
The basic timebase for any electronic device is a quartz oscillator. Quartz crystals are inexpensive but commonly have an error of 30 to 50 parts per million, which is not good enough for our use. By hand picking components and comparing the result to a precision reference, it’s possible to get a quartz timebase to run within one part per million. This corresponds to a clock error of about a second per week and is the accuracy we use in the standard MicroSet timer. It’s been our experience that this calibration is very stable. Timers that come back to us two years later are always within 2 parts per million of the original value. Often they haven’t changed at all. But a quartz timebase will change with temperature. On a hot day the circuit will speed up, which makes the clock you’re measuring seem to run slower. We’ve found this error to be about a second a week for four degrees of temperature change. The following graph shows the temperature error in an uncorrected timer. (We’ll be looking at several graphs, and they’re all screen shots of the MicroSet Windows Interface Software. There’s a lot of information shown in these screens, but all we care about now is the graph in the center. In these graphs, the vertical axis represents the size of a reading. The horizontal axis represents the passage of time as more readings are captured.) For this graph, the timer was configured to measure the interval between pulses of an atomic reference. These pulses occur exactly once per second. Any reading that’s not one second can be attributed to an error in the timer. The red line in the middle of the graph records the readings from the timer, the green line below it is the room temperature. This graph covers four days. The peaks in the lower line show the temperature getting warmer every day and cooling off at night. You can see a one part per million error in the timer reading every time the temperature reaches the high for the day. At the end of the graph, during a particularly cool night, the timer reading dropped by one part per million. The next morning the furnace turned on and stabilized the temperature and the readings.
---- Page 2 ----
|
