|
Measuring Clocks and Watches
Optical Sensors Pros
Cons
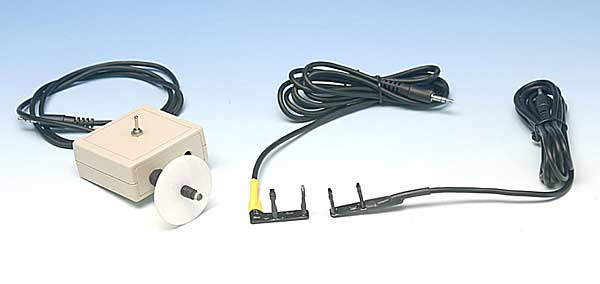
The second most common sensor used to measure pendulums is optical. It uses a light source shining on a photodetector. When the pendulum passes between the emitter and detector it interrupts the beam, and triggers the timing circuit. Optical sensors are much more accurate than acoustic sensors. This photograph shows some of the optical sensors we make. The sensor on the left uses a laser beam, the two on the right use LED light sources. The LED sensors are mounted at the bottom of the pendulum or arranged somewhere along the pendulum rod. The laser can be arranged to shine through the glass door of a closed clock and measure the pendulum in a closed case or vacuum tank.
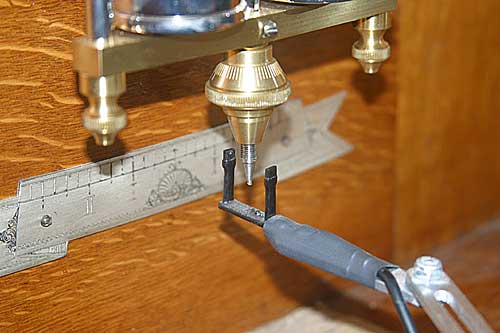
This photograph shows an optical sensor mounted at the tip of a pendulum.
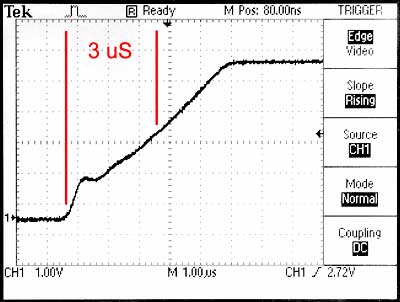
The signal out of an optical sensor changes much more quickly than a sound signal. This oscilloscope trace of an optical sensor is much more magnified than the trace of the acoustic sensor we saw a moment ago. The signal passes the three volt threshold within three microseconds. This is 60 times better than the acoustic sensor. In addition, unlike a sound wave, the signal rises nearly straight up and is always the same shape. Every time the sensor is triggered, the signal crosses the three volt threshold within three microseconds.
We’ve also begun to make a precision optical sensor that uses photodetectors made for the fiber optic communications industry. These have a rise time of less than a tenth of a microsecond. Another benefit of the optical sensor is that it measures the clock at a different location than a microphone does. It measures at the pendulum. The steady motion of a heavy pendulum is inherently more consistent than the jumpy motion of a light-weight escape wheel. If your goal is the measurement of the overall rate of the clock, rather than analysis of the escapement, these measurements will be very much more accurate and stable. This graph shows a comparison between an acoustic sensor and an optical sensor. The first half of the graph is the measurement of a 60 beat clock with an acoustic sensor. The alternating high and low readings are evidence of the amount of jitter in each reading. The second half of the graph is the same clock, with the same settings, measured with an optical sensor. The improvement is obvious. At this scale, there is no jitter visible in the readings.
|