|
The Wind
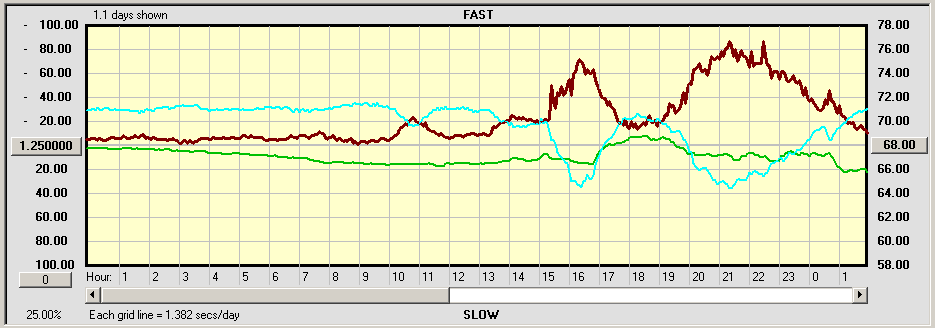
Recently we noticed that the clock rate, which had been running smoothly for several days, became substantially disturbed for no apparent reason. In the graph below you can see that the rate (dark red line) is stable until about 10 o'clock. Then it gets progressively more disturbed, with two big peaks. The amplitude (light blue line) follows in a mirror image. Notice also that the temperature (green line) became disturbed starting around 10 AM. A check of the video camera showed no unusual activity that would account for these disruptions.
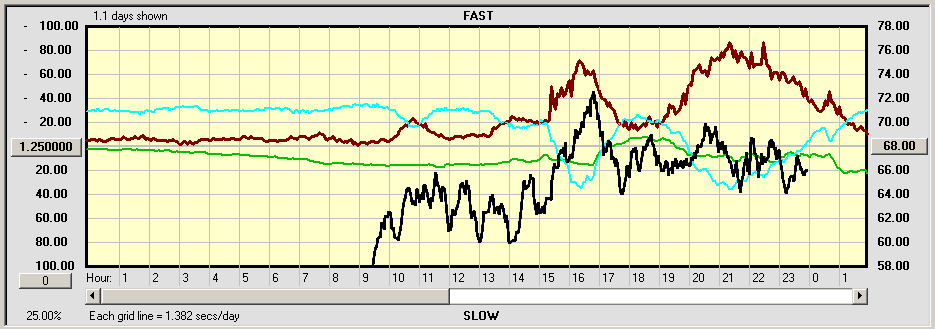
The next morning I went down to examine the clock and found nothing unusual in the mechanism. But I noticed a breeze in the room. There are four openings in the walls (about one foot square) for the outdoor speakers that play the chimes. The speakers are not currently installed, and these openings are usually covered. But they had been uncovered. And it occurred to me that it had been particularly windy in Santa Barbara the day before. Rodney mentioned that it had been breezy in the clock room on the previous day. I was able to locate a record of the previous day's wind speed from a nearby weather station. The wind started at 9 AM that day, and the graph of wind speed closely follows the disturbance to the clock. In the graph below, the wind speed is plotted as a black line and aligned with the clock data. Mystery solved. If the clock is exposed to the outside with four small windows, the wind can blow in and disrupt the pendulum. The temperature fluctuations were caused by the movement of air through the room.
|