The MicroSet Graph
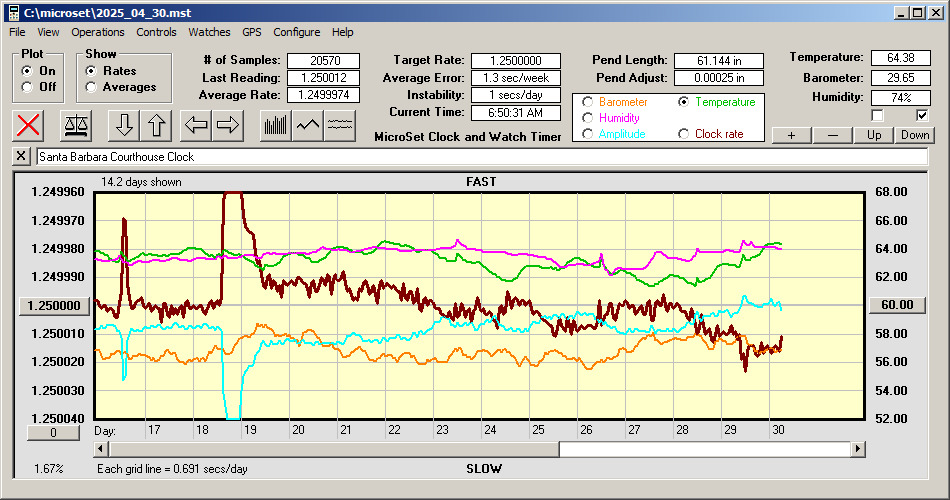
This graph shows the Seth Thomas tower clock performance at the present time. The clock rate may be shown as a dark blue or dark red line, depending on how the software is configured. The ideal rate for the Seth Thomas clock is 1.250000 seconds, which is shown at the middle of the graph. If the rate line is below the middle of the graph, the clock is running slow. If its above the middle line, the clock is running fast. Atmospheric sensors are also indicated in the graph. You can tell one from another by the color coding in the "button box" above the graph. The barometric pressure is in orange, the humidity is purple, the temperature is green, and the "amplitude" is blue. The legend at the right side of the graph is the scale for the currently selected sensor. Usually it shows the temperature readings. The value in the bottom left corner of the window indicates the horizontal scale of the graph. If it reads less than "100.00%", the scale is compressed to fit more data on the screen, and every reading is not shown. To the right of this is a legend that indicates how much timekeeping error is represented by each horizontal line above or below the middle of the graph. Vertical lines through the graph indicate the start of each hour (or day, if several days are displayed). There are several text boxes above the graph to indicate details of the data. "# of samples" shows how many readings have been collected in this file. "Last reading" is the last measurement of the pendulum that was taken by the MicroSet timer. "Average" is the average rate over the current data file. "Target rate" is the correct rate for the clock, which for this clock is 1.250000 seconds. "Average error" tells us how fast or slow the clock's average rate is over the duration of the current data file. "Instability" tells us how consistent the clock has been over the time measured. The Seth Thomas is so good this will probably always be zero. "Pend length" is the functional length of the clock pendulum as calculated from the measured rate. "Pend adjust" tells us how far (in inches) we would need to move the bob to make the clock run exactly correct. To refresh the page and update the graph to the current time, refresh the page in your browser or click here. To see a graph of yesterday's clock behavior, click here. To see a graph of current clock behavior that updates every minute, click here.
|