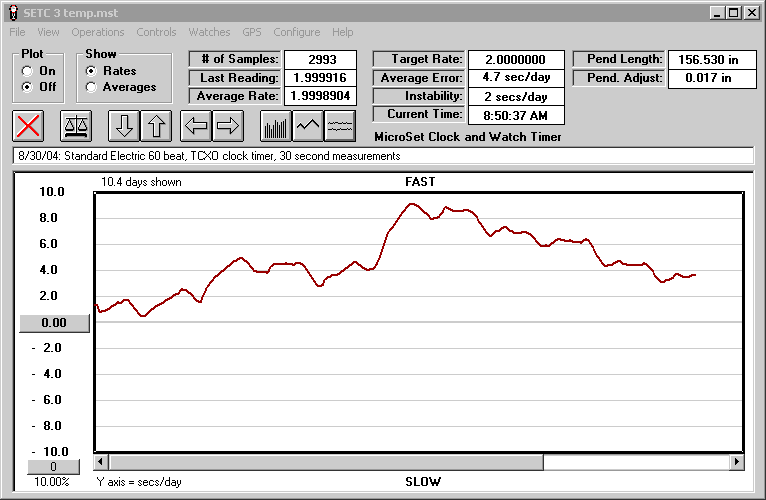
Using the MicroSet atmospheric sensor The MicroSet atmospheric sensor can reveal effects on a pendulum from changes in barometric pressure, temperature, and humidity. The sensor has separate elements for detecting each of these three environmental factors. To illustrate this, take a look at the graph below. It shows the rate of a 60 beat Standard Electric clock over ten days. This is a standard "school house" clock. It has a wooden pendulum rod and a lenticular brass bob. The graph shows that the clock tended to run fast, but more so in the middle of the graph. The scale at the left axis indicates error in seconds per day. The average rate of this clock over ten days was 4.7 seconds per day fast.
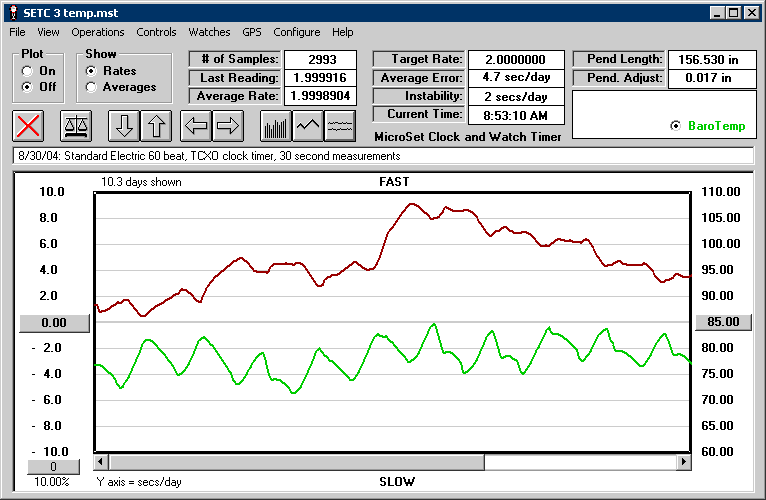
In the next graph, the changes in temperature inside the clock case are plotted along with the rate. (The clock door was left open to allow temperature changes to reach the clock easily.) You can see some obvious correlations. Every time the temperature goes up, the clock tends to slow down. This is typical behavior. When the clock gets warmer the pendulum rod tends to expand, growing longer. The temperature heats up every day and cools off each night. But the temperature doesn't seem to explain the general rise in rate near the middle of the graph.
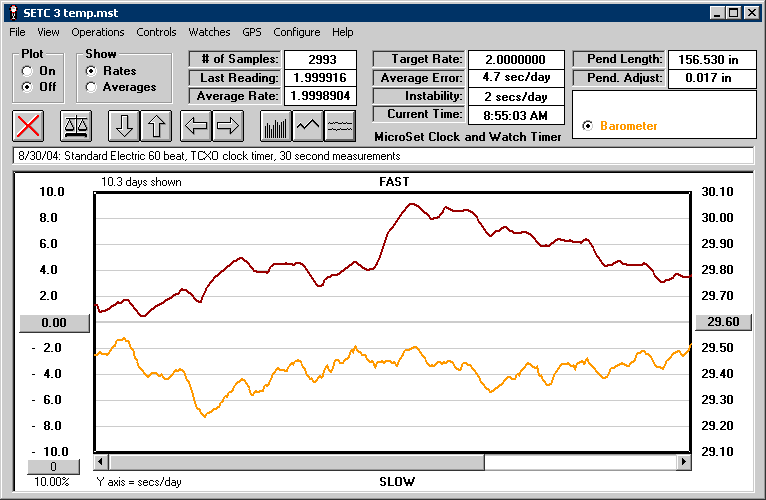
The next graph shows the rate in comparison with the barometer. The barometer didn't change much in these ten days. There doesn't seem to be much correlation between the barometer and the rate.
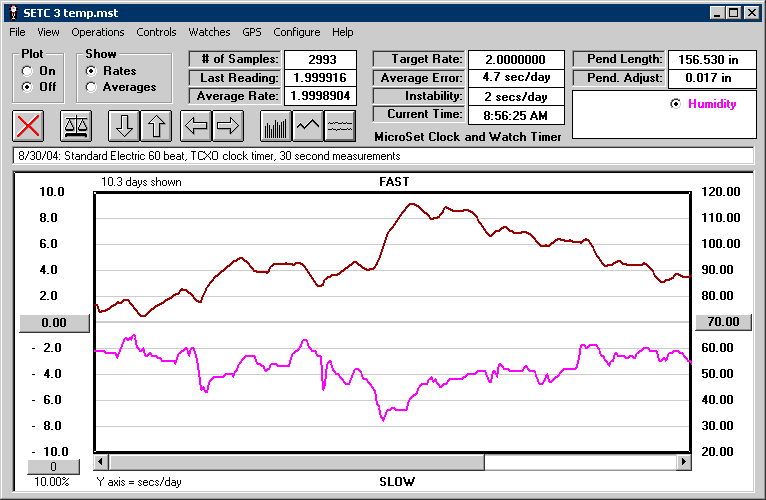
The next graph shows the rate in comparison with the humidity. There seems to be a correlation here. Notice that the rate tends to go up some time after the humidity goes down. The time lag between the two changes is several hours. This seems to indicate that this clock is effected by humidity, and maybe even more so than by temperature. Since the correlation is not instantaneous, but follows by several hours, it suggests that the effect is not due to the immediate change of the air density by water content, but rather that the wooden pendulum rod is changing gradually in response to the humidity. The direction of change could be attributed to shrinkage in the wooden rod as it dries out in lower humidity. As the humidity gradually rises at the end of the graph, the rate gradually falls. But note that the humidity does not quite return to the same level it started at, and neither does the rate.
Bryan Mumford
|


